From Weeks to Days: How Plan in Fabric Reinvents the Budget Cycle
Excel was never designed to be the system of record for enterprise budgeting. Here are the 10 ways manual, spreadsheet-based planning breaks down — and how Planning in Fabric (Plan, in preview) fixes each one.
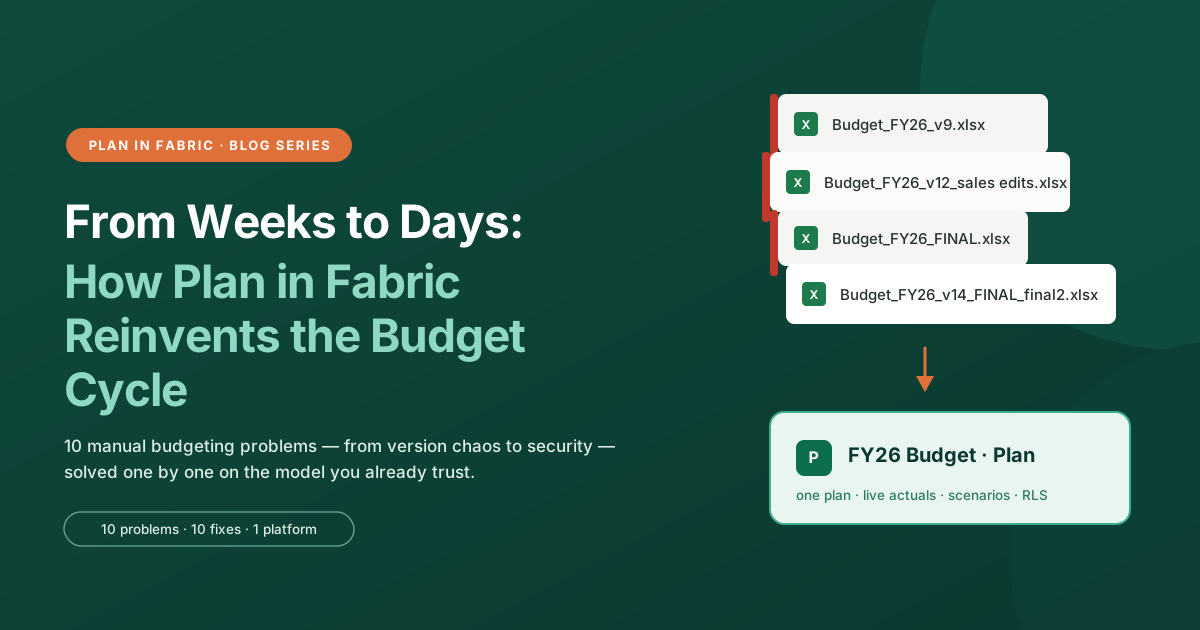
It's budget season. Somewhere in your organization right now, a file called Budget_FY26_v14_FINAL_final2.xlsx is making its way through an email thread. Three department heads have three different versions open. Someone just pasted values over a formula and nobody noticed. And your finance team — the people you hired to analyze the business — are spending their week reconciling spreadsheets instead of actually planning.
Sound familiar? It should. This is how most organizations still run budgeting and forecasting in 2026.
Let me be clear about one thing upfront: Excel is not the villain here. It's the most successful business tool ever built, and for good reason. Everyone knows it. Nobody needs training. You can model almost anything in it. That familiarity is exactly why it survives every "Excel is dead" prediction.
The problem isn't Excel the tool. The problem is Excel as the system of record for enterprise planning. A spreadsheet was never designed to be a multi-user, governed, auditable, dimensional planning platform — and the moment your planning process involves more than a handful of people, more than a few dimensions, and more than one version of the truth, it starts to break in predictable, expensive ways.
Until recently, the answer was "buy a dedicated planning tool" — another platform, another data silo, another integration project. That changed at FabCon Atlanta 2026, when Microsoft announced Planning in Fabric IQ, a first-party planning capability built directly into Microsoft Fabric (the workspace item is called Plan, currently in preview). It brings budgeting, forecasting, and scenario modeling onto the same governed data and shared semantic models your reports already run on — while keeping a spreadsheet-like experience your finance team will actually recognize.
In this post, I'll walk through the 10 most common problems I see in manual, Excel-based budgeting and forecasting — and exactly how Plan in Fabric addresses each one.
Problem 1: Version Chaos — "Which File Is the Truth?"
Every planning cycle produces the same artifact: a graveyard of file versions. v9 went to the CFO. v11 has the updated headcount numbers. v12 is the one Sales edited — or was it v13? Someone merged two of them at midnight and now there are numbers nobody can trace.
This isn't carelessness. It's structural. Excel files are copies by design. Every time you email a workbook, save it to a new folder, or share it "just for reference," you create a fork. Forks drift. And once they drift, someone has to spend hours reconciling them — hours that produce zero business value.
The real cost isn't just the reconciliation time. It's the meeting where leadership makes a decision based on v11 while Finance is looking at v13. When two people in the same room have different numbers for the same line item, trust in the entire planning process evaporates.
How Plan in Fabric fixes it: There is one Plan. It lives as a single governed item in a Fabric workspace. Department heads, analysts, and reviewers all contribute to the same plan — nobody emails a copy, because there is no copy. Different views of the future aren't files; they're scenarios inside the model (more on that in Problem 7).
Takeaway: One plan, one truth. Versions become scenarios — not files.
Problem 2: Manual Data Collection & Consolidation
Ask any FP&A analyst how a budget cycle starts, and they'll describe the same ritual: export actuals from the ERP, clean them up, paste them into the template, email the template to twelve departments, chase the ones who didn't respond, then manually merge everything back together. By the time the data is consolidated, it's already a week old — and the cycle repeats next month.
The structural cause: Excel has no living connection to your source systems. Data moves through humans — export, copy, paste, merge — and every human touchpoint is both a delay and an error opportunity. One misaligned paste and the Q3 actuals are sitting in the Q4 column.
The cost is measured in days per cycle. Some finance teams spend 60–70% of their planning time just assembling data, leaving a fraction for actual analysis and decision support.
How Plan in Fabric fixes it: The plan doesn't collect data — it sits directly on your Fabric semantic model, the same governed model your reports already run on. That model is already connected to your ERP and source systems through OneLake shortcuts/mirroring/Pipeline, so by the time planning starts, the actuals are simply there — and every refresh of the model is a refresh of your planning baseline. Nobody exports, nobody pastes, nobody chases — the model your organization already trusts becomes the starting point of every cycle.
Takeaway: Stop collecting data. Start planning on the model you already trust.
Problem 3: Broken Formulas & Fragile Links
Here's a horror story every finance team has lived: someone inserts a row, and a SUMIFS three tabs away silently starts grabbing the wrong range. Or a workbook gets moved to a new folder and every external link breaks. Nothing errors out. Nothing turns red. The model just quietly starts producing wrong numbers — and nobody notices until the review meeting, or worse, after the board deck goes out.
Why does this keep happening? Because in Excel, data, logic, and input all live in the same cells. There's no boundary between "the model" and "the place where people type." Any user with edit access can — with one keystroke, entirely by accident — corrupt logic that took weeks to build. Research on spreadsheet quality has found errors in the overwhelming majority of large operational spreadsheets, and planning workbooks are among the largest and most-touched files in any company.
The cost here isn't just wrong numbers. It's credibility. The first time leadership catches a broken formula in the budget, every number you present afterward gets the skeptical squint.
How Plan in Fabric fixes it: Planning happens in structured Planning sheets, where dimensions, measures, and business rules are defined once at the model level. Contributors enter data in a governed grid — they can adjust the plan, but they can't accidentally rewrite the logic. The spreadsheet-like experience stays; the fragility goes.
Takeaway: In Excel, everyone can edit the logic. In Plan, they can only edit the plan.
Problem 4: Stale Actuals — The Plan Drifts From Reality
Your forecast was accurate on the day it was built. That was three weeks ago. Since then, actuals moved, a major deal slipped, and costs came in higher than expected — but the spreadsheet doesn't know any of that. Re-forecasting means re-importing, re-pasting, and re-building, so it happens quarterly at best. Most annual plans are effectively dead by Q2; teams just keep reporting against them anyway.
The structural cause: an Excel file is a snapshot. It captures the world at the moment of its last manual refresh, and it drifts from reality every day after that.
The cost: decisions made on projections that no longer reflect the business. In a fast-moving environment, a stale forecast can be worse than no forecast — it carries the authority of a plan with the accuracy of a guess.
How Plan in Fabric fixes it: Forecasts in Plan run directly on live semantic models and update as new actuals become available. Built-in forecast methods — copying historical values, applying averages, formula-driven projections, or manual adjustments — combined with time intelligence and period extensions make rolling forecasts practical instead of painful. Instead of a static annual plan, you re-forecast continuously as reality unfolds.
Takeaway: A plan that can't see actuals isn't a plan — it's a guess with formatting.
Problem 5: No Audit Trail — "Who Changed This Number?"
Somewhere between version 9 and version 12, the travel budget jumped 40%. Nobody remembers approving that. Nobody admits changing it. The change history is spread across file copies, email threads, and someone's memory of a hallway conversation.
Excel's Track Changes exists, but let's be honest: it's clunky, it's off by default, and it dies the moment someone saves a copy. In practice, a shared spreadsheet has no reliable answer to "who changed this, when, and why."
For a casual file, that's an annoyance. For the document that determines how your company allocates money, it's a governance failure. Auditors ask these questions. Regulators ask these questions. And internally, the lack of attribution turns every discrepancy into a blame game.
How Plan in Fabric fixes it: Governance is built in, not bolted on. Plan provides audit trails, approval workflows, and role-based access controls as part of the platform. Every input is attributable to a person and a point in time. Submissions flow through a defined approval process instead of "reply-all with your numbers by Friday."
Takeaway: If you can't answer "who changed this and when," you don't have a planning process — you have a shared file.
Problem 6: Collaboration Is Sequential, Not Simultaneous
The classic Excel planning workflow is a relay race. Finance builds a template and sends it to twelve department heads. Then waits. Then sends reminders. Then chases the two departments who always submit late. Then manually merges twelve files back into the master — carefully, because one wrong paste undoes everything. If anyone needs to revise after seeing the consolidated picture, the whole loop runs again.
Modern Excel co-authoring helps for simple files, but complex planning models with heavy formulas, links, and protected ranges don't survive simultaneous editing well — so most teams fall back to the relay race.
The cost: planning cycles measured in weeks instead of days. And because each iteration is so expensive, teams do fewer iterations — which means less refinement, less negotiation between top-down targets and bottom-up reality, and a worse plan.
How Plan in Fabric fixes it: Everyone contributes to the same shared plan, at the same time. Role-based access means each department sees and edits only their slice (see Problem 10), while workflow management tracks who has submitted, who's pending, and what's approved. Top-down targets and bottom-up inputs meet in one model instead of colliding in a merge.
Takeaway: Planning is a team sport. Excel turns it into a relay race.
Problem 7: Scenario Modeling = Copy-Paste Hell
The CFO asks a perfectly reasonable question: "What does the plan look like if revenue comes in 10% under?" In Excel, answering it means duplicating the entire workbook, changing the assumptions, and then maintaining two files in parallel. Add a best case and you're maintaining three. Every subsequent change to shared logic has to be applied to all of them — and eventually it isn't, and the scenarios silently diverge.
The structural cause: Excel has no native concept of a scenario. Every alternate future is a fork of the file, with all the version-chaos problems from Problem 1 multiplied.
The cost is subtle but serious: because scenario analysis is so expensive to build and maintain, teams simply stop doing it — precisely at the moments of uncertainty when leadership needs it most.
How Plan in Fabric fixes it: Scenario modeling is a first-class capability, not a file-copying exercise. Define your assumptions, simulate multiple scenarios on the same model, run what-if assessments, and compare outcomes side by side instantly. Best case, base case, and downside case are views of one model — change the shared logic once and every scenario reflects it. Both top-down and bottom-up planning workflows are supported.
Takeaway: Scenarios should be a dropdown, not a duplicate file.
Problem 8: Excel Chokes at Dimensional Scale
Real planning is dimensional. You don't budget one number — you budget by product, by region, by department, by month, sometimes by customer segment or channel. Multiply those dimensions and you're quickly at hundreds of thousands of combinations. In Excel, that becomes an 80 MB workbook that takes four minutes to open, freezes on recalculation, and occasionally corrupts on save. IT tells you to split it up. Splitting it up brings back Problems 1, 2, and 6.
The structural cause: a flat grid was never designed for dimensional models. Pivot tables and Power Pivot stretch the limits, but the file-on-a-laptop architecture eventually loses to the math.
The cost is worse than slow files: teams respond by planning at a coarser grain than the business actually needs — budgeting at the division level because product-level detail would kill the workbook. The plan loses exactly the detail that would make it actionable.
How Plan in Fabric fixes it: Multi-dimensional breakdown is built into the planning model itself. Enter a value at a summary level and break it down across dimensions — product, region, department, time — using allocation logic, or plan at detail and let it roll up automatically. Because the plan is aligned with your Fabric semantic model, the dimensional heavy lifting happens in the platform — not in a file gasping for memory on an analyst's laptop. Plan at the grain the business needs, not the grain the file can survive.
Takeaway: Your planning grain should be a business decision, not a file-size limitation.
Problem 9: Variance Analysis Is a Manual Afterthought
Month-end arrives, and with it the ritual: pull actuals, line them up against plan, build the variance columns, calculate percentages, color the cells, and then start the real work — figuring out why each variance happened, usually by emailing department heads and waiting. Two days later, the analysis is ready. The month is already three days old.
The structural cause: in Excel, comparison logic has to be rebuilt or re-fed every single period, and explanation is entirely manual detective work.
The cost: insight arrives late and shallow. Under deadline pressure, "why did marketing overspend?" gets a guessed answer instead of an investigated one. Leadership gets a rearview mirror when they needed a windshield.
How Plan in Fabric fixes it: Intelligence sheets provide automated variance analysis directly over your planning data — surfacing variances, trends, and forward-looking implications without you rebuilding the comparison every month. And because the plan lives on the same semantic model as your reporting, Power BI dashboards show plan vs. actuals natively — no exports, no reformatting, no "let me update the deck."
Takeaway: Spend your month-end explaining the business — not building the comparison.
Problem 10: Security & Access — All or Nothing
The sales team should see their region's plan — and only theirs. HR's salary planning must stay locked to three people. The Excel answer to this is either twelve separate files (hello again, Problem 1) or one master file protected by hidden tabs and a worksheet password — which any determined user can bypass in under a minute. Let's say it plainly: hidden tabs are not security.
The structural cause: Excel offers file-level protection in a world that needs row-level and role-level control. There is no native way to give different people different slices of the same workbook, securely.
The cost is a forced choice between two bad options: data exposure risk (salary data one unhide-click away) or version sprawl (a file per audience, drifting independently). Most organizations end up with both.
How Plan in Fabric fixes it: Access control operates at the platform level. Role-based permissions determine exactly which slice of the plan each contributor can see and edit — one plan, many secure views. And because the plan sits on a Fabric semantic model, row-level security (RLS) applies to the data itself: Sales West sees West's rows, Sales East sees East's, and HR's salary lines are invisible to everyone outside the role — enforced by the model, not by a hidden tab. Governance, compliance, and workspace security are inherited from Fabric, the same framework already protecting your data estate, rather than improvised inside a file.
Takeaway: Hidden tabs are not access control.
Same Team, Next Cycle
Picture that same team from the opening — one budget cycle later.
There's no v14. There's one Plan item in a Fabric workspace. Actuals flow in from the ERP through OneLake; nobody pasted anything. Twelve departments entered their numbers into their own governed slice of the same model, simultaneously, and Finance watched submissions arrive through the workflow instead of chasing them. The CFO asked for a downside scenario and got it the same afternoon — as a view, not a new file. When a number looked off, the audit trail answered "who and when" in seconds. And the month-end variance story was waiting in an Intelligence sheet and a Power BI report before anyone opened a deck template.
Here's the quick map of everything we covered:
| # | Excel Problem | Plan in Fabric Fix |
|---|---|---|
| 1 | Version chaos | One governed Plan item — scenarios, not file copies |
| 2 | Manual data collection | Plan built on the semantic model, already fed by ERP |
| 3 | Fragile formulas | Structured Planning sheets — logic separated from input |
| 4 | Stale actuals | Live semantic models, rolling forecasts |
| 5 | No audit trail | Built-in audit trails and approval workflows |
| 6 | Sequential collaboration | Simultaneous, role-scoped contribution |
| 7 | Copy-paste scenarios | Native scenario modeling and what-if analysis |
| 8 | Dimensional scale limits | Multi-dimensional breakdown built into the planning model |
| 9 | Manual variance analysis | Intelligence sheets + native Power BI reporting |
| 10 | All-or-nothing security | Role-based access + semantic model RLS |
If you're already on Microsoft Fabric, the argument is simple: your governed data foundation and semantic models are already there. Planning on top of them isn't a new tool purchase with a year-long integration project — it's the natural next step for the platform you already own.
Over the coming weeks, I'll show how Plan in Fabric solves each of these 10 problems with hands-on, step-by-step guides — one problem at a time. Follow along if budget season has ever cost you a weekend.
Questions, or want to talk through how this could work in your own Fabric environment? Get in touch.
Naming note for the curious: "Planning in Fabric IQ" is the capability name Microsoft uses; "Plan (preview)" is the actual item you create in a Fabric workspace. Both refer to the same experience.